Virtual Machine Monitoring via SNMP
To monitor parameters from within your windows virtual machines you will require two items to be installed:
a. Monitoring server
A virtual machine deployed on the VMhosts dedicated for internal monitoring for each of the clients. This will be connected to the same VLAN as the client.
Example specifications: VM specifications: 1 core, 2GB RAM, 10 GB storage
b. SNMP Service (Agent) installed in the WIndows Virtual Machines you wish to monitor.
Ensure Windows firewall allows SNMP traffic.
Step 1:
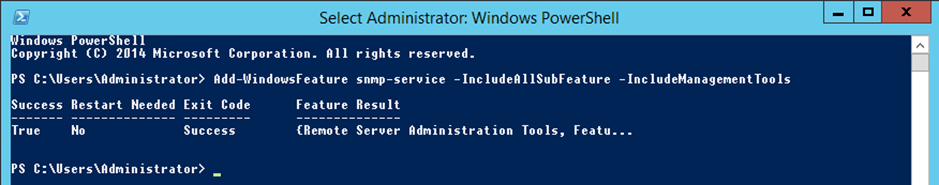
Installing the SNMP Service, sub features and management tools: This can be done via the add remove features or via PowerShell using the following command on the nominated Server:
For Wndows Powershell 2014 edition, use : ‘Add-WindowsFeature snmp-service –IncludeAllSubfeatures -IncludeManagementTools’
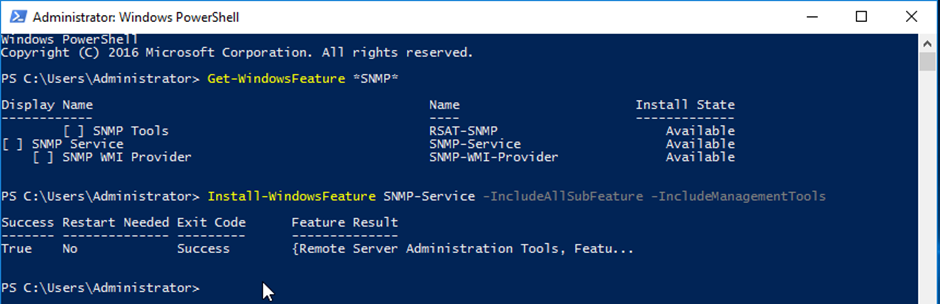
For Windows Powershell 2016 edition, use
To check if SNMP is installed, ‘Get-WindowsFeature *SNMP*’
To install SNMP, ‘Install-WindowsFeature SNMP-Service -IncludeAllSubFeature -IncludeManagementTools’
Step 2:
Open the ‘Services’ panel via Control Panel / Administrative Tools or by right clicking the start button, selecting ‘Run’ and entering services.msc followed by ‘OK’
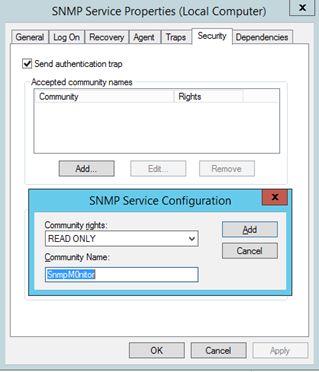
Next we will need to click the Security tab followed by the ‘Add’ button under the ‘Accepted Community Names” title. You can now enter in a community name that’s relevant to you, for this example we have used ‘SnmpM0nitor’
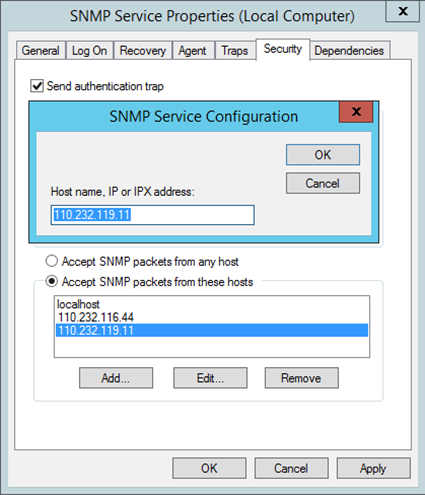
Now we will need to configure where the server will accept SNMP Packets from, this is configured under the “Accept SNMP packets from these hosts” title, click on ‘ADD’ button and enter in the IP address/es of the SNMP Monitoring Servers you just set up.
Once completed select Apply and OK to exit. Restart the service by right clicking on the ‘SNMP Service” and selecting Restart
Step 3:
After SNMP has been installed and configured you will need to download and install the following application “SNMP-Informant” - http://www.wtcs.org/informant/files/informant-std-17.zip
This will provide SNMP the correct MIBs for the Cloud Monitoring Service – the additional MIB’s structure the collected information in a compatible format .
Step 4:
Firewall rules will need to be updated to allow the incoming SNMP requests, open ‘Windows Firewall with Advanced Settings” which is located in ‘Control Panel’ then ‘Administrative Tools’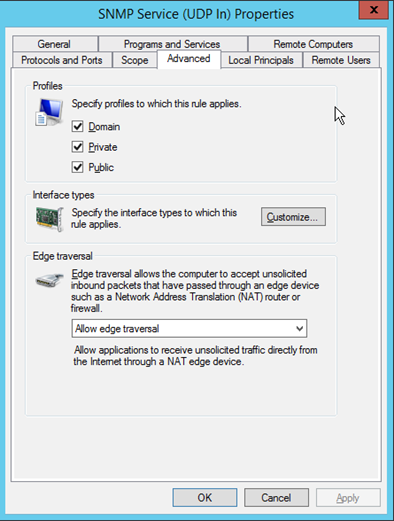
Locate the existing ‘SNMP Sevice (UDP In) rules and double click the first one (which one is not important), select the ‘Advanced Tab’ and make sure ‘Domain, Private & Public’ are ticked then change the ‘Edge Traversal’ to ‘Allow Edge Traversal’. Select OK and close the remaining windows.
Step 5:
Within the Cloud portal, navigate to the server which has the SNMP Agent installed (Services / Servers Tab). Once on the Server Summary page select the Monitoring Tab.
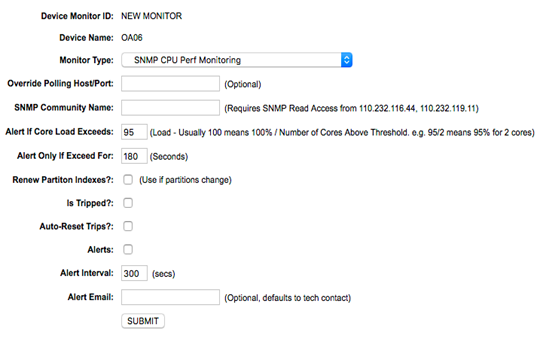 Select ‘ADD NEW MONITOR’ followed by the ‘Monitor Type’ you are after. The following page will contain the fields required for your Cloud Monitoring System to successfully monitor the desired server.
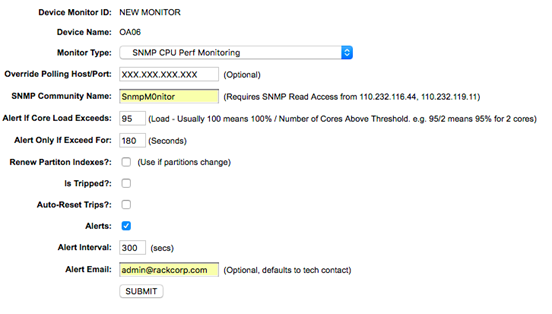
We recommend populating the following fields:
SNMP Community Name: will be the SNMP community string previously defined in Step 2
Alert Threshold: If your monitoring CPU specify the CPU load that will trigger an alert.
Alert Only if Exceed for: How long the alert threshold is exceed for in duration to trigger an alert (Important as brief CPU spikes do occur)
Alert: This will enable alerts to be created if the alert parameters are met.
Alert Email: Nominate a email address to receive the alert.
Providing these fields are populated, then select Submit. You will be brought back to the previous page “Monitoring Tab” where you will see the new monitor appear. The metrics will start to flow in and you should see some information after 10 minutes. You can then add more monitors depending on your requirements.
Step 6: This step is only required if your server has a Private IP Address and is behind a NAT Firewall.
Prior to this step, it is expected that a Public IP NAT or PAT would have been made on your perimeter firewall to the nominated Server(s). NAT & PAT instructions are not included in this document due to the variety of firewalls available – we recommend you speak to you firewall management vendor to configure this for you.
Once you are aware of your Servers Public IP Nat and the associated firewall rule is enabled to allow SNMP (port 161 UDP), then you will need to edit the ‘Additional Information’ field on the Server Summary Page.
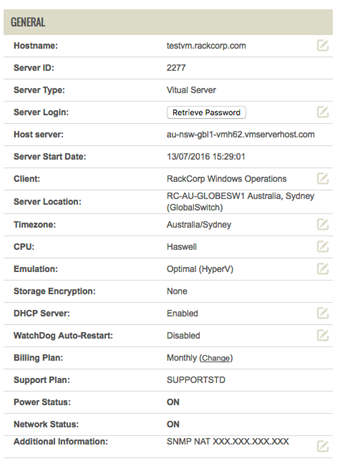 The information to be inserted is: “SNMP NAT <ip address>” where the <ip address> will contain the Public IP provided by your Firewall Management vendor.
If you have used AT, you will need to specify the port after the IP Address with a semi colon used as a separator. e.g. 110.232.116.11:14000
Click Submit and your monitor should being to show metrics within 10 minute.
No comments to display
No comments to display